Back to Catalog
Nutrient & Health Score Comparison
Side-by-side comparative analysis of FMCG product formulation, sugar, trans fat, and INS additives.
Nutrients are normalized per 100g / 100ml. Data is referenced directly from statutory packaging label declarations.
| Compare Metrics | Product 1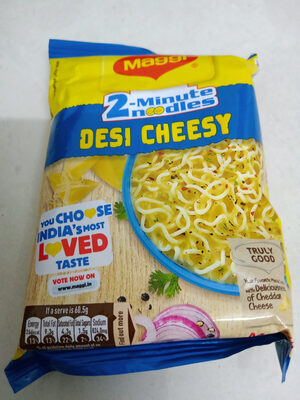 | Product 2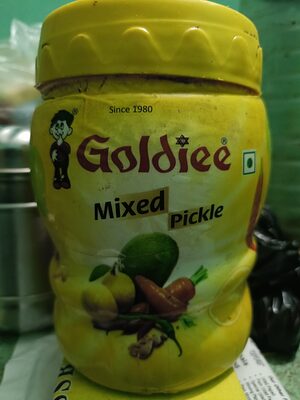 |
|---|---|---|
| Health score | Unrated | Unrated |
| HFSS status | HFSS flag recorded
| No HFSS flag recorded; not a compliance determination. |
| Declared allergens | No declarations available; not an allergen-free claim. | No declarations available; not an allergen-free claim. |
| Added sugars | 1.49g | — |
| Saturated fat | 7.11g | 1.3g |
| Sodium | 1361.98mg | — |
| Dietary status | Unknown | Vegetarian |
| Ingredients | Read ingredientsIf a serve is 60.5g NUTRITION Per Per XGDA*Per INFORMATION 100g serve 13% serve 439 266 5.8 12% Energy (kcal Protein (g) Carbohydrate (g) - Total Sugars(g) 9.6 10 65.7 39.7 15% 2% 2.5 1.5 - Sugar (Sucrose)/g) 1.5 0.9 5% 22 1.3 13% - Fiber (g) Total Fat (g) - Saturated Fat (g) - Trans Fat (g) é 153 9.3 7.2 43 22% 0.13 0.08 34% Sodium (mg) 1362.0 824.0 | Unavailable |
| Barcode | 8901058875324 | 8904053502493 |
| Full Audit | View complete audit → | View complete audit → |