Back to Catalog
Nutrient & Health Score Comparison
Side-by-side comparative analysis of FMCG product formulation, sugar, trans fat, and INS additives.
Nutrients are normalized per 100g / 100ml. Data is referenced directly from statutory packaging label declarations.
| Compare Metrics | Product 1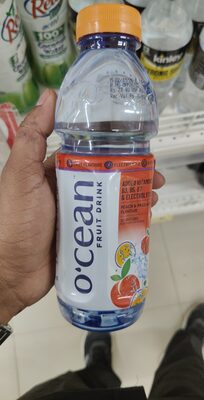 | Product 2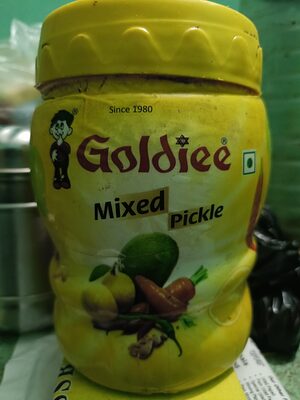 |
|---|---|---|
| Health score | Unrated | Unrated |
| HFSS status | HFSS flag recorded
| No HFSS flag recorded; not a compliance determination. |
| Declared allergens | No declarations available; not an allergen-free claim. | No declarations available; not an allergen-free claim. |
| Added sugars | 10g | — |
| Saturated fat | — | 1.3g |
| Sodium | 5mg | — |
| Dietary status | Unknown | Vegetarian |
| Ingredients | Read ingredientsde mark and does ot represent its true nature. No. of servings 2. Serving S particles may appear due to presence of minerals. FLAVOURING SUBSTANCES). CONTAINS FRUIT READY TO SERVE FRUIT BEVERAGE NUTRITIONAL UOM APPROX. VALUES FACTS Energy Carbohydrate Total Sugar Added Sugar Protein - Total Fat - Cholesterol Sodium Potassium Magnessium* Kcal g g g ca ca ca ca ca ge ge PER (100 ML) 42 10 RDA(%) PER SERVING (250 ML) 5.25 19.23 10 10 50 0.5 2.31 0 0 ថខū · -%RDA not established. -%RDA calculated on the basis of | Unavailable |
| Barcode | 8908001658041 | 8904053502493 |
| Full Audit | View complete audit → | View complete audit → |